- Published on
차트 라이브러리 없이 canvas 태그로 차트 그리기
- Authors

- Name
- Hayden Moon
- Github
- @moonhyeonjun
Canvas 태그 속성과 활용법
HTML5의 canvas 태그는 그래픽을 그릴 수 있는 도구를 제공합니다. canvas 요소는 픽셀 기반의 비트맵 영역을 제공하며, JavaScript를 사용해 이 영역에 그림을 그릴 수 있습니다. canvas를 사용하면 2D 및 3D 그래픽을 생성할 수 있어 다양한 시각적 요소를 동적으로 추가할 수 있습니다.
Canvas 태그
<canvas id="myChart" width="800" height="600"></canvas>
canvas 태그는 width와 height 속성을 사용해 크기를 정의합니다. 이 속성들은 CSS를 통해 스타일링할 수 있지만, 속성 자체를 통해 정의된 크기와 스타일링된 크기 간에 차이가 있을 수 있으므로 주의가 필요합니다.
Canvas 컨텍스트(ctx) 속성 및 메서드
canvas 태그로 그래픽을 그리기 위해서는 getContext('2d') 메서드를 사용해 2D 렌더링 컨텍스트를 가져와야 합니다. 이 컨텍스트 객체는 다양한 그래픽 그리기 메서드와 속성을 제공합니다.
예제 코드

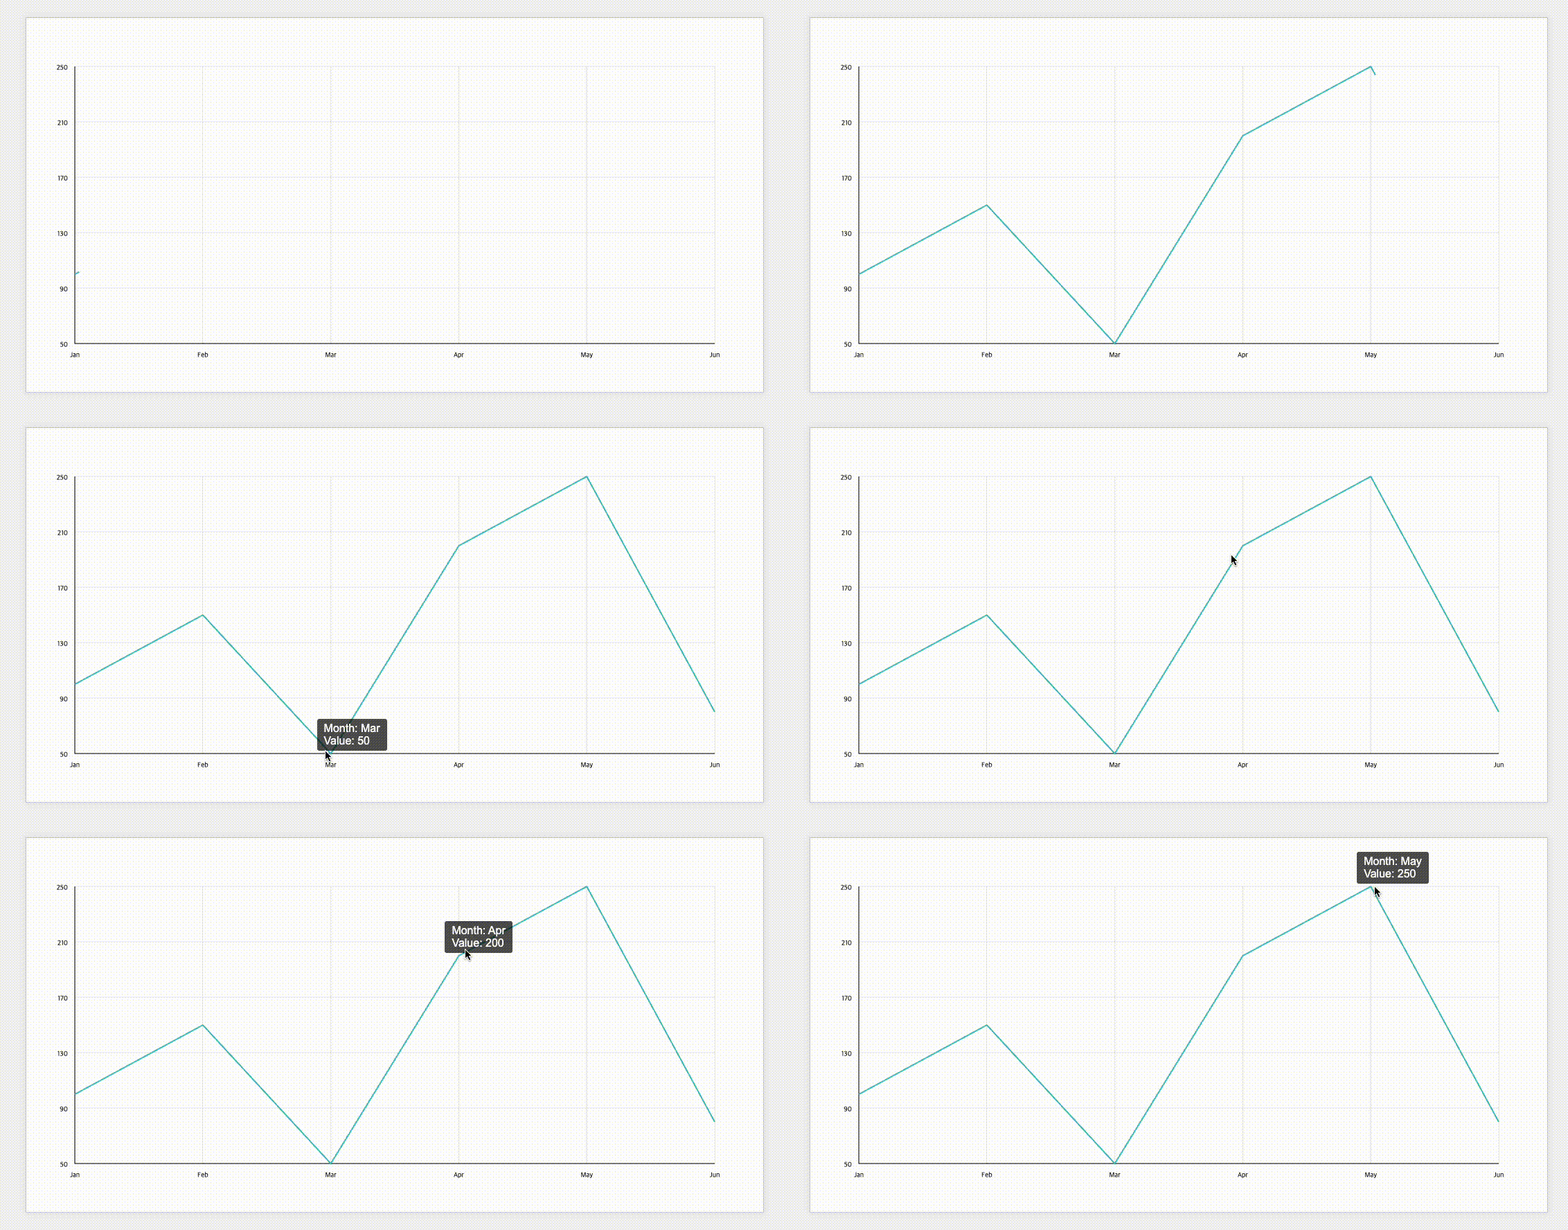
아래의 코드는 기본적인 선형 차트를 그리기 위한 전체 코드입니다.
<!doctype html>
<html lang="en">
<head>
<meta charset="UTF-8" />
<meta name="viewport" content="width=device-width, initial-scale=1.0" />
<title>Line Chart</title>
<style>
/* 스타일링을 위한 CSS */
body {
font-family: Arial, sans-serif;
margin: 0;
padding: 0;
display: flex;
justify-content: center;
align-items: center;
height: 100vh;
background-color: #f4f4f4;
}
.chart-container {
width: 80%;
height: 500px;
border: 1px solid #ccc;
background: #fff;
padding: 20px;
box-shadow: 0 0 10px rgba(0, 0, 0, 0.1);
position: relative;
}
canvas {
width: 100%;
height: 100%;
}
.tooltip {
position: absolute;
background: rgba(0, 0, 0, 0.7);
color: #fff;
padding: 5px 10px;
border-radius: 3px;
pointer-events: none;
display: none;
}
</style>
</head>
<body>
<div class="chart-container">
<canvas id="myChart"></canvas>
<div class="tooltip" id="tooltip"></div>
</div>
<script>
// 데이터 정의
const data = [100, 150, 50, 200, 250, 80]
const labels = ['Jan', 'Feb', 'Mar', 'Apr', 'May', 'Jun']
// Canvas 설정
const canvas = document.getElementById('myChart')
const ctx = canvas.getContext('2d')
const tooltip = document.getElementById('tooltip')
// 크기 설정
const width = (canvas.width = canvas.offsetWidth)
const height = (canvas.height = canvas.offsetHeight)
// 차트 여백 설정
const padding = 50
const chartWidth = width - padding * 2
const chartHeight = height - padding * 2
// 데이터 범위 설정
const maxValue = Math.max(...data)
const minValue = Math.min(...data)
// x축 간격 설정
const xStep = chartWidth / (labels.length - 1)
// 애니메이션 변수
let progress = 0
const animationDuration = 2000 // 애니메이션 지속 시간 (밀리초)
let startTime = performance.now()
let currentPointIndex = 0
// 데이터를 캔버스 좌표로 변환
function getCanvasCoordinates(index) {
const x = padding + xStep * index
const y =
padding + chartHeight - ((data[index] - minValue) / (maxValue - minValue)) * chartHeight
return { x, y }
}
// 라인 그리기
function drawLine() {
ctx.beginPath()
ctx.moveTo(getCanvasCoordinates(0).x, getCanvasCoordinates(0).y)
for (let i = 1; i < data.length; i++) {
ctx.lineTo(getCanvasCoordinates(i).x, getCanvasCoordinates(i).y)
}
ctx.strokeStyle = 'rgba(75, 192, 192, 1)'
ctx.lineWidth = 2
ctx.stroke()
}
// 부드러운 라인 그리기 (애니메이션)
function drawSmoothLine(animatedProgress) {
ctx.beginPath()
ctx.moveTo(getCanvasCoordinates(0).x, getCanvasCoordinates(0).y)
for (let i = 1; i <= currentPointIndex; i++) {
const previous = getCanvasCoordinates(i - 1)
const current = getCanvasCoordinates(i)
if (i === currentPointIndex) {
const progressX = previous.x + (current.x - previous.x) * animatedProgress
const progressY = previous.y + (current.y - previous.y) * animatedProgress
ctx.lineTo(progressX, progressY)
} else {
ctx.lineTo(current.x, current.y)
}
}
ctx.strokeStyle = 'rgba(75, 192, 192, 1)'
ctx.lineWidth = 2
ctx.stroke()
}
// 애니메이션 루프
function animateChart(currentTime) {
const elapsedTime = currentTime - startTime
const segmentDuration = animationDuration / (data.length - 1)
progress = (elapsedTime % segmentDuration) / segmentDuration
if (
elapsedTime >= segmentDuration * currentPointIndex &&
currentPointIndex <= data.length - 1
) {
currentPointIndex++
}
// 캔버스를 지우고 다시 그리기
ctx.clearRect(0, 0, canvas.width, canvas.height)
drawAxes()
drawLabels()
drawGridLines()
drawSmoothLine(progress)
if (currentPointIndex < data.length - 1 || progress < 1) {
requestAnimationFrame(animateChart)
}
}
// x축과 y축 그리기
function drawAxes() {
ctx.beginPath()
ctx.moveTo(padding, padding)
ctx.lineTo(padding, height - padding)
ctx.lineTo(width - padding, height - padding)
ctx.strokeStyle = '#000'
ctx.lineWidth = 1
ctx.stroke()
}
// 축 라벨 그리기
function drawLabels() {
ctx.fillStyle = '#000'
ctx.textAlign = 'center'
for (let i = 0; i < labels.length; i++) {
const x = padding + xStep * i
const y = height - padding + 20
ctx.fillText(labels[i], x, y)
}
// y축 라벨 그리기
ctx.textAlign = 'right'
const yStep = (maxValue - minValue) / 5
for (let i = 0; i <= 5; i++) {
const y = padding + chartHeight - ((yStep * i) / (maxValue - minValue)) * chartHeight
ctx.fillText((minValue + yStep * i).toFixed(0), padding - 10, y + 5)
// 가로선 그리기
ctx.beginPath()
ctx.moveTo(padding, y)
ctx.lineTo(width - padding, y)
ctx.strokeStyle = 'rgba(0, 0, 0, 0.1)'
ctx.lineWidth = 1
ctx.stroke()
}
}
// 차트 그리기 (초기화 및 애니메이션 시작)
function drawChart() {
startTime = performance.now()
currentPointIndex = 0
progress = 0
requestAnimationFrame(animateChart)
}
// 새로운 함수: 세로선 그리기
function drawGridLines() {
ctx.strokeStyle = 'rgba(0, 0, 0, 0.1)'
ctx.lineWidth = 1
for (let i = 0; i < labels.length; i++) {
const x = padding + xStep * i
ctx.beginPath()
ctx.moveTo(x, padding)
ctx.lineTo(x, height - padding)
ctx.stroke()
}
}
// 툴팁 표시
function showTooltip(event) {
const rect = canvas.getBoundingClientRect()
const mouseX = event.clientX - rect.left
const mouseY = event.clientY - rect.top
for (let i = 0; i < data.length; i++) {
const { x, y } = getCanvasCoordinates(i)
if (Math.abs(mouseX - x) < 10 && Math.abs(mouseY - y) < 10) {
tooltip.style.left = `${x}px`
tooltip.style.top = `${y - 30}px`
tooltip.innerHTML = ``
tooltip.style.display = 'block'
return
}
}
tooltip.style.display = 'none'
}
canvas.addEventListener('mousemove', showTooltip)
drawChart()
</script>
</body>
</html>
ctx 객체의 주요 속성과 메서드
strokeStyle: 선의 색상을 지정합니다.
ctx.strokeStyle = 'rgba(75, 192, 192, 1)'
lineWidth: 선의 두께를 지정합니다.
ctx.lineWidth = 2
beginPath(): 새로운 경로를 시작합니다.
ctx.beginPath()
moveTo(x, y): 펜을 특정 좌표로 이동시킵니다.
ctx.moveTo(50, 50)
lineTo(x, y): 현재 위치에서 특정 좌표까지 선을 그립니다.
ctx.lineTo(100, 100)
stroke(): 현재 경로를 따라 선을 그립니다.
ctx.stroke()
fillText(text, x, y): 특정 위치에 텍스트를 그립니다.
ctx.fillText('Hello, World!', 150, 150)
clearRect(x, y, width, height): 특정 영역을 지웁니다.
ctx.clearRect(0, 0, canvas.width, canvas.height)
결론
canvas 태그와 ctx 객체를 사용하면 동적인 그래픽과 애니메이션을 웹 페이지에 추가할 수 있습니다. 위의 예제에서는 애니메이션과 툴팁 기능이 있는 선형 차트를 구현했습니다. 이를 통해 HTML5 캔버스의 다양한 기능과 활용 방법을 이해할 수 있었습니다.